Smart-Citizen-Map
Physical data-visualizator
INTRO
To really talk about Smart Cities means to talk about Smart Citizens. We live at a time where great amounts of data are produced by sensors, wearable devices, and mobile phones. These data are harvested, analysed and used by companies and City Councils in an attempt to manage and control the city from a top-down and centralised manner. While such management and control are supposed to contribute to citizens' wellbeing and safety, in most cases citizens are largely out of the loop. In fact, they often do not take part in the generation, analysis or use of the data, either because they do not have access to them or because they do not have the knowledge to perform such appropriations.
To empower users to take ownership of smart technologies and data, it is necessary to create interfaces that creatively engage people and facilitate processes of data sensemaking and analysis. If these data were to be exclusively managed by governments and corporations, citizens could lose ownership of their urban environments and services… And even worse, we could pave the way towards a surveillance society.
In an attempt to design new interfaces to foster citizen engagement with data and sensemaking, we propose the Smart Citizen Map. It is an interface aimed to visualise and understand the behaviour of noise in the city of Barcelona, showing real time generated data and it's variation in order to encourage the citizen to establish relationships and comparisons among them.
DESCRIPTION
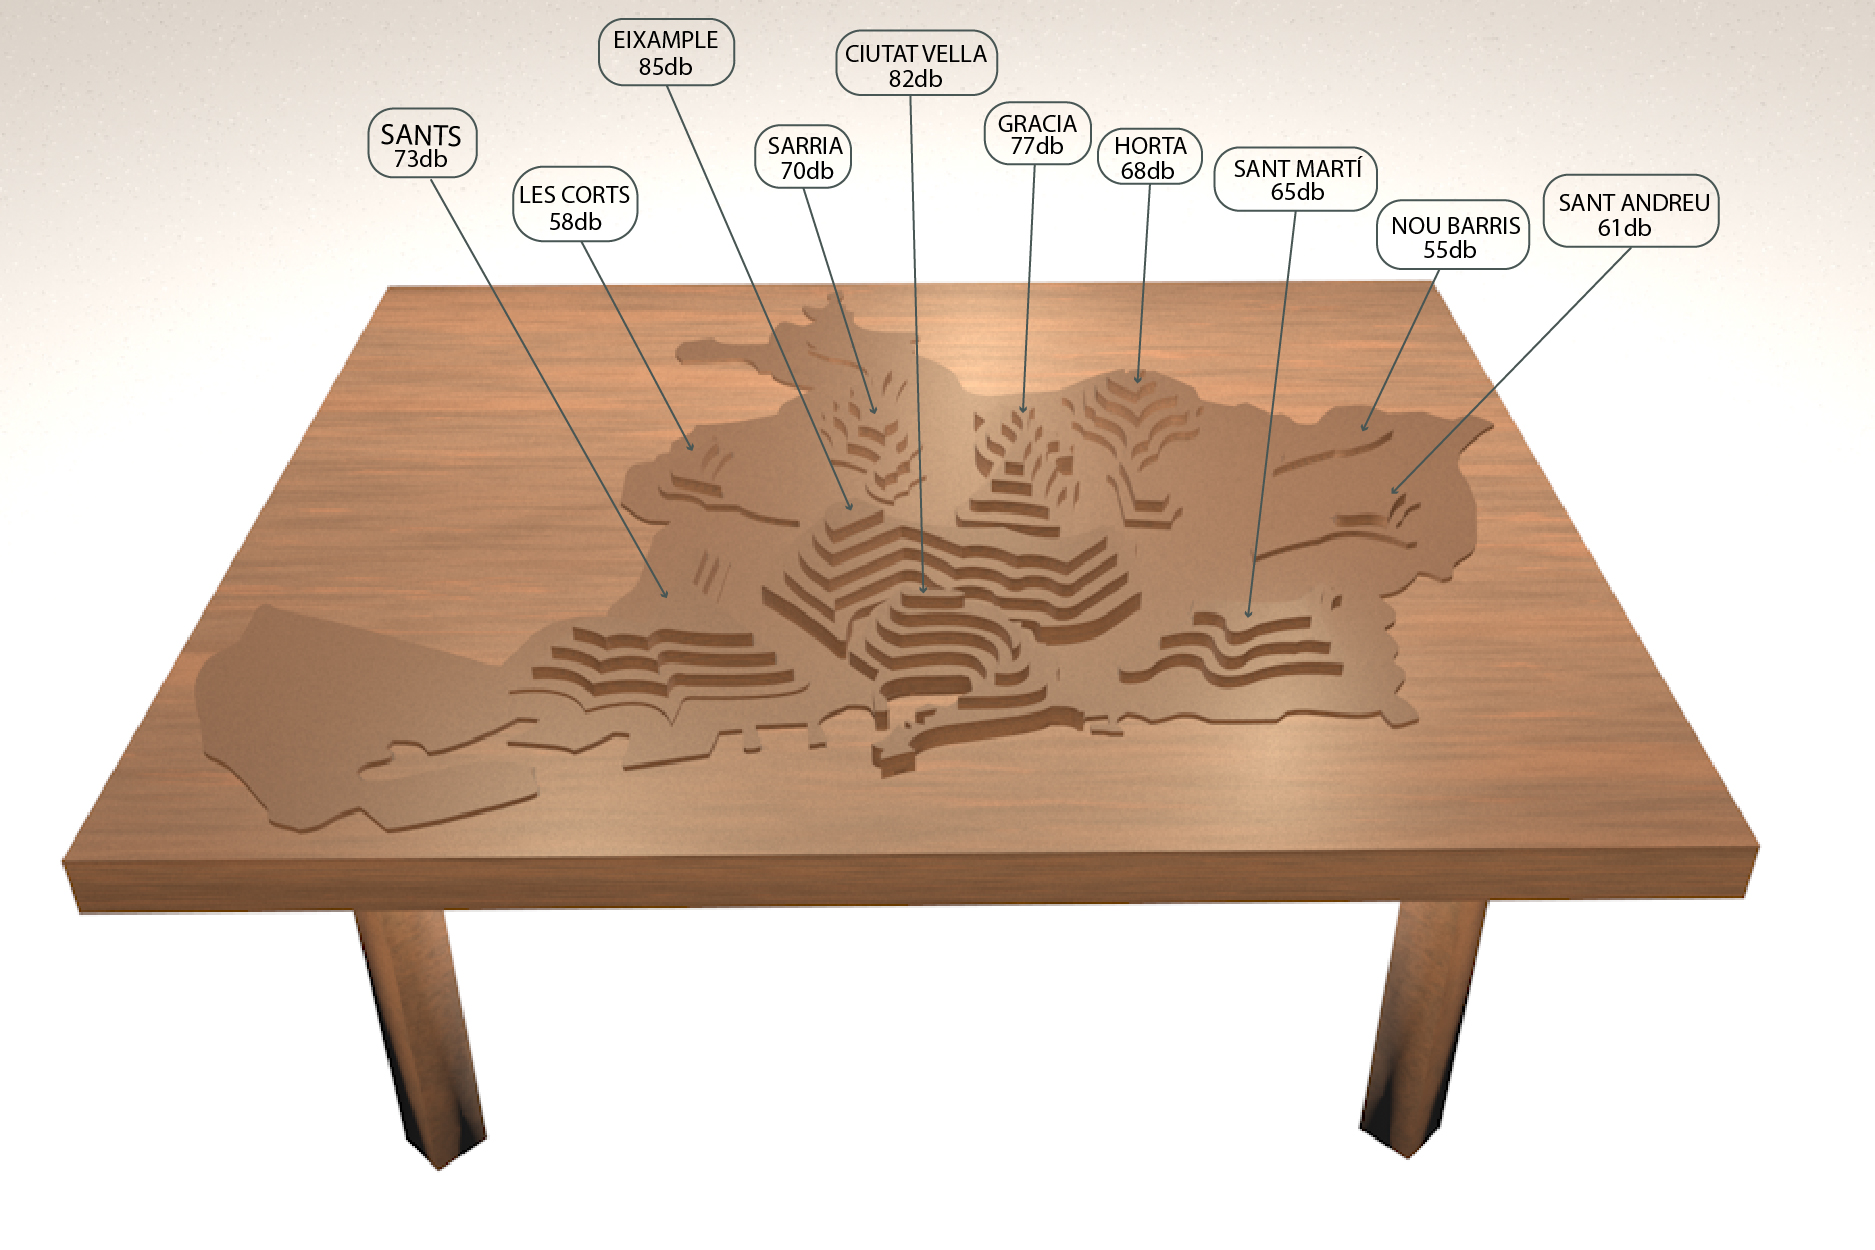
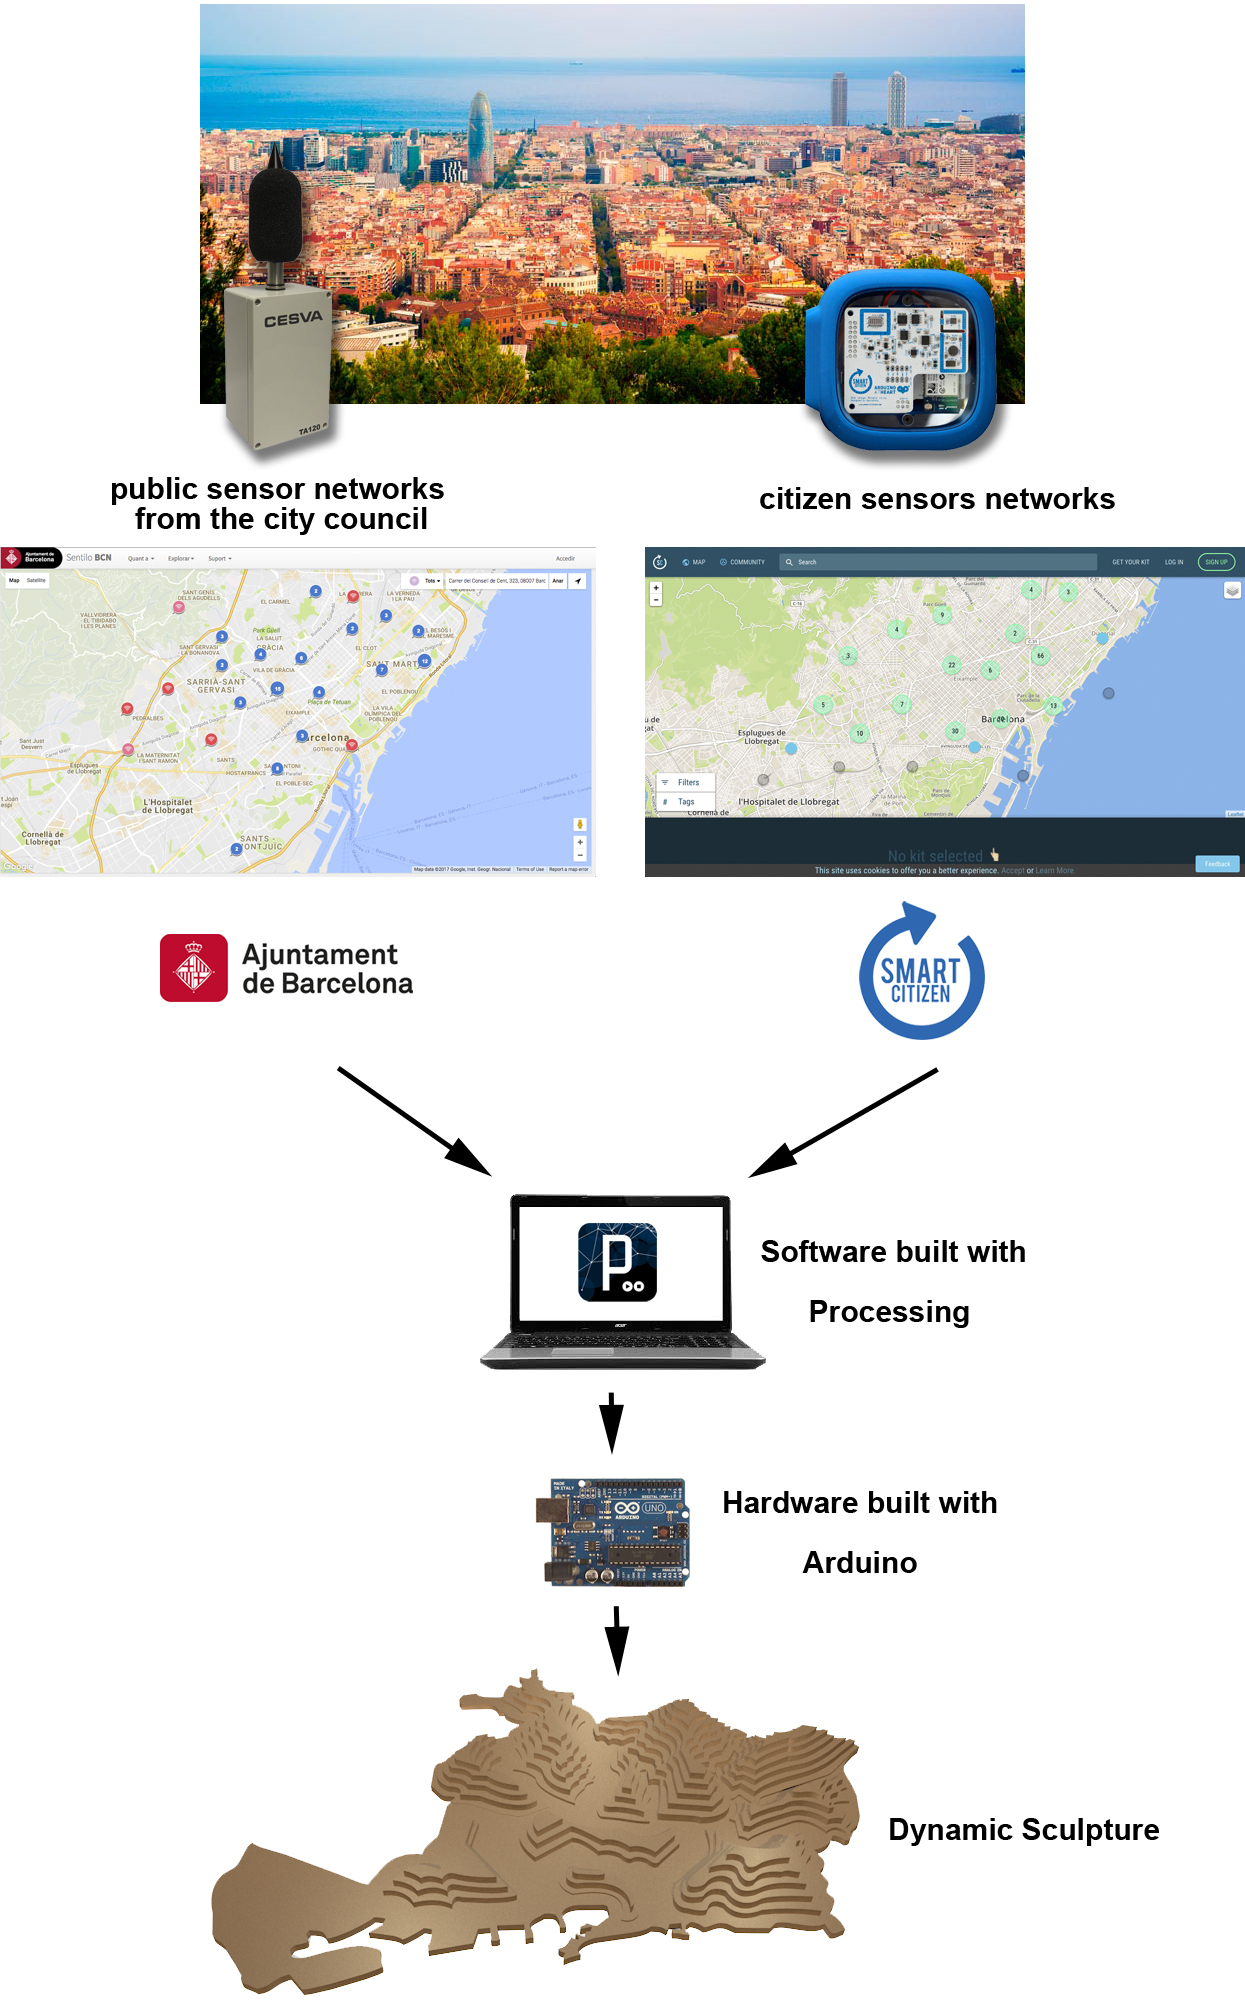
Smart Citizen Map is a dynamic-topographic sculpture depicting the city, where the terrain's heights evolve continuously in relationship with real time data on noise levels. The data would be collected both by public institutions and local residents. On the one hand, we would use the public sensor networks from the city council (Sentilo BCN) and, on the other hand, we would collect data from 50 engaged citizens who are participating in citizen sensor networks (SmartCitizen.me and Making-sense.eu):
- Sentilo BCN - Ayutamiento de Barcelona is an open source platform developed by the City Council of Barcelona to gather, analyze and spread the information generated by the sensors deployed in the city.
- Smart Citizen is a citizen-led sensor networks and an open-source platform to generate participative processes within the cities, connecting data, people and knowledge.
how it works?
Smart Citizen Map gathers and compares the official data from the city council with the data from the Smart Citizen network and creatively shows them, aiming to get citizens and technology closer together, providing tools for a collective sensemaking of the city for their own citizens.
Smart Citizen Map is an Open-Source project that comprises 2 technological layers: a hardware device, and a software, developed with Open-Source technologies: Arduino and Processing. The software interpolates the official data with the citizen data to get noise levels. It is very important to convey that the data obtained by the interpolation is approximate, and its main purpose is to help citizens to understand what happens throughout the city. It's a visualization project that aims to make visible the data of noise to see how they perform, react and interact with the rest of the city. Moreover, it can be replicated using other data sets to interrogate different environmental concerns such as air quality, light or radiation pollution. In its first iteration we focus on noise pollution because it has been repeatedly identified as a concern for local communities in Barcelona, Madrid and Valencia.
The results of these data feed a physical prototype made with balsa wood depicting the city, which can change the height in relation to the noise with a DIY motor system and with a real time vertical projection mapping over the sculpture to show meta-data.
